Tier 2 — Aurora Continuum Self-hosted

Quality outcomes
mapped to business value.

Continuum is the self-hosted pipeline aggregation layer of the Aurora Platform. It executes test packs, aggregates results across every major framework, tracks change signals in your repositories, and connects quality outcomes to the initiatives and DORA metrics your leadership actually cares about.

Kubernetes Linux macOS Windows (WSL2)

Test results that nobody above engineering can use.

Your CI/CD pipeline produces test results. Your DORA metrics tell you deployment frequency and lead time. But these things live in separate tools, in formats your leadership can't read, with no connection to the delivery workstreams those leaders are accountable for.

When a release approaches, the quality conversation starts from scratch — someone pulls a report, someone else asks which tests cover this change, and the risk decision is made without the information needed to make it well. Continuum is the connective layer that fixes this.

Playwright E2E / UI
Cypress E2E / Component
Selenium UI / Legacy
JUnit Unit / Integration

No rip and replace. Continuum works with your existing test investment.


From pipeline results to programme-level quality intelligence.

Continuum runs self-hosted inside your own infrastructure. It connects to your CI/CD pipelines, ingests results from all your test frameworks, and builds a quality picture mapped to your repositories, change signals, and business workstreams.

Test pack execution Continuum executes test packs pushed from Aurora — triggered by pipeline events, scheduled, or on-demand. Sensitive Aurora pack credentials are stored encrypted at rest and decrypted only inside the Playwright Worker at execution time, never written to disk in the clear. Results are captured in a normalised format regardless of which framework ran them.
Multi-framework aggregation Results from Playwright, Cypress, Selenium, and JUnit are pulled into a single quality view. No more switching between tool dashboards, no more manually assembling a picture from four sources.
Change signal tracking Continuum monitors your repositories for change signals — commits, merges, branch activity — and maps quality outcomes against them. When a change lands, you know immediately what test coverage it has and what the trend looks like.
Business initiative mapping Quality outcomes are mapped to your programme-level delivery workstreams. The CTO doesn't need to read test results — they can see which initiatives are green, which are at risk, and why.
DORA metrics integration Continuum tracks deployment frequency, change failure rate, mean time to recovery, and lead time alongside your quality data — giving engineering leadership the complete delivery picture in one place.
Signals to Sentinel Quality trends, change signals, and risk indicators flow upward into Aurora Sentinel — the change control plane that gives leadership the evidence-based risk view for every release decision.

Self-hosted. Your data stays inside your infrastructure.

For regulated industries and security-conscious engineering organisations, data sovereignty isn't a feature request — it's a requirement. Continuum is designed from the ground up to run entirely within your own perimeter.

Your test results, change signals, and quality trends are never transmitted to an external SaaS platform. You own the deployment, you control the data, and your existing security posture applies without exemptions.

  • Runs on your own Kubernetes cluster or on-premise infrastructure
  • No external SaaS data transmission — all processing inside your perimeter
  • Private container images pulled from your own registry
  • GitOps deployment model — change-controlled, auditable
  • SAP Integration Module available for enterprise procure-to-pay test coverage

“Your DORA metrics tell you how fast you're shipping. They don't tell you whether what you're shipping is safe. Continuum is the layer that connects those two things.”

— Martin Croft, Founder, Selectred

Next in the platform — Tier 3

Continuum signals flow into Sentinel

Sentinel ingests quality trends, change signals, and risk indicators from Continuum to produce an evidence-based risk picture for every release — designed for CTOs and programme directors.

Explore Sentinel →

Built for the whole organisation

Continuum delivers value across the business. See what it means for your role.

Full data ownership All results, metrics, and audit logs stay on your infrastructure. No third-party data processors — no subprocessor agreements to manage.
Predictable costs No per-test, per-user, or per-GB billing. One flat licence for your whole organisation, regardless of test volume or team size.
Compliance-ready PDF audit reports with sign-off blocks and configurable data retention. Designed for regulated industries where data residency matters.
Executive visibility Team, Manager, and Executive dashboards built in. Give stakeholders the quality picture they need — no custom report requests, no data exports.
No vendor lock-in Your data lives in persistent volumes you control. Export, migrate, or archive on your own schedule — without negotiating with a vendor.
DORA at programme level Track deployment frequency, lead time, change failure rate, and MTTR across all your teams from one dashboard — no BI tooling required.

Multi-framework results
Playwright, Cypress, Selenium, JUnit, pytest and more — one unified view.
Three dashboard tiers
Team, Manager, and Executive views — the right data for every audience.
DORA metrics
Deployment frequency, lead time, change failure rate, and MTTR — built in.
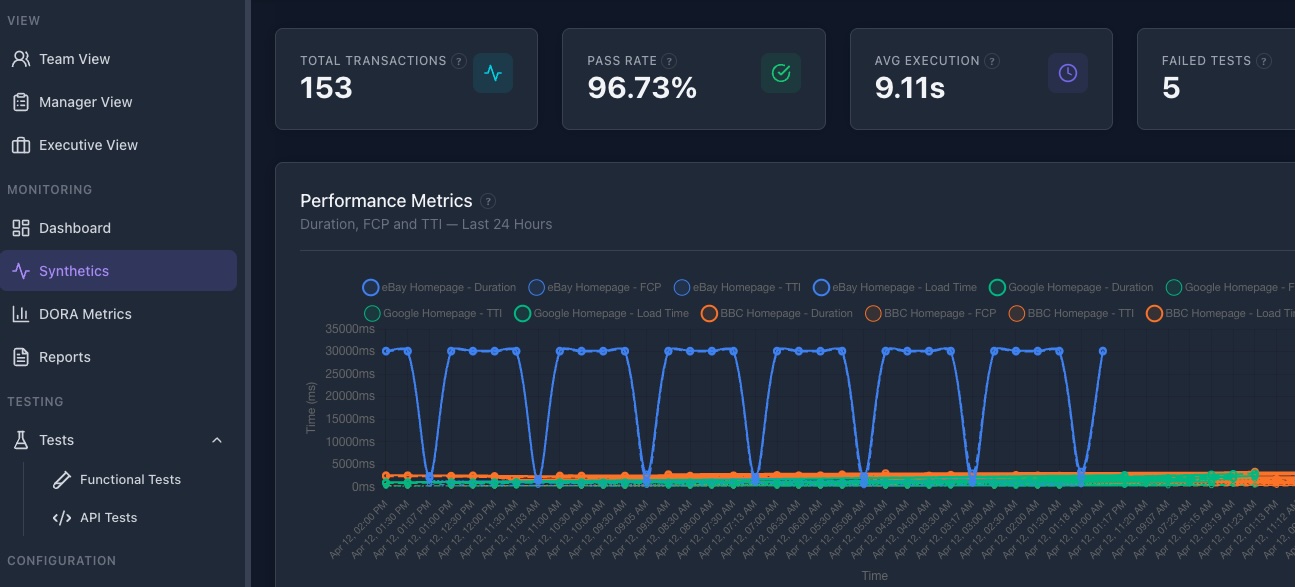
Synthetic monitoring
Scheduled Playwright transactions that continuously verify your live environments.
Fully self-hosted
Your data stays in your infrastructure. No cloud sync, no telemetry, no third parties.
Compliance reports
Audit-ready PDF reports with sign-off blocks — built for regulated environments.

See it in action

Every view runs inside your own infrastructure — your data, your cluster.
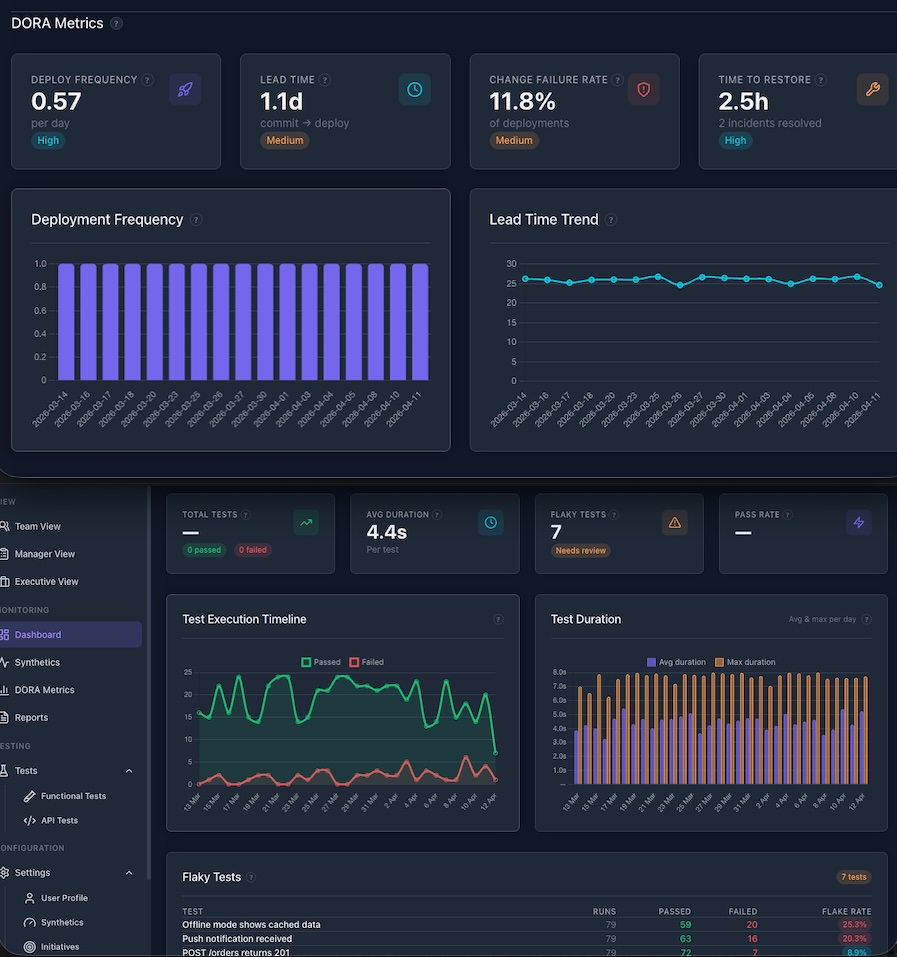
DORA Metrics and Team Dashboard
DORA Metrics & Team Dashboard
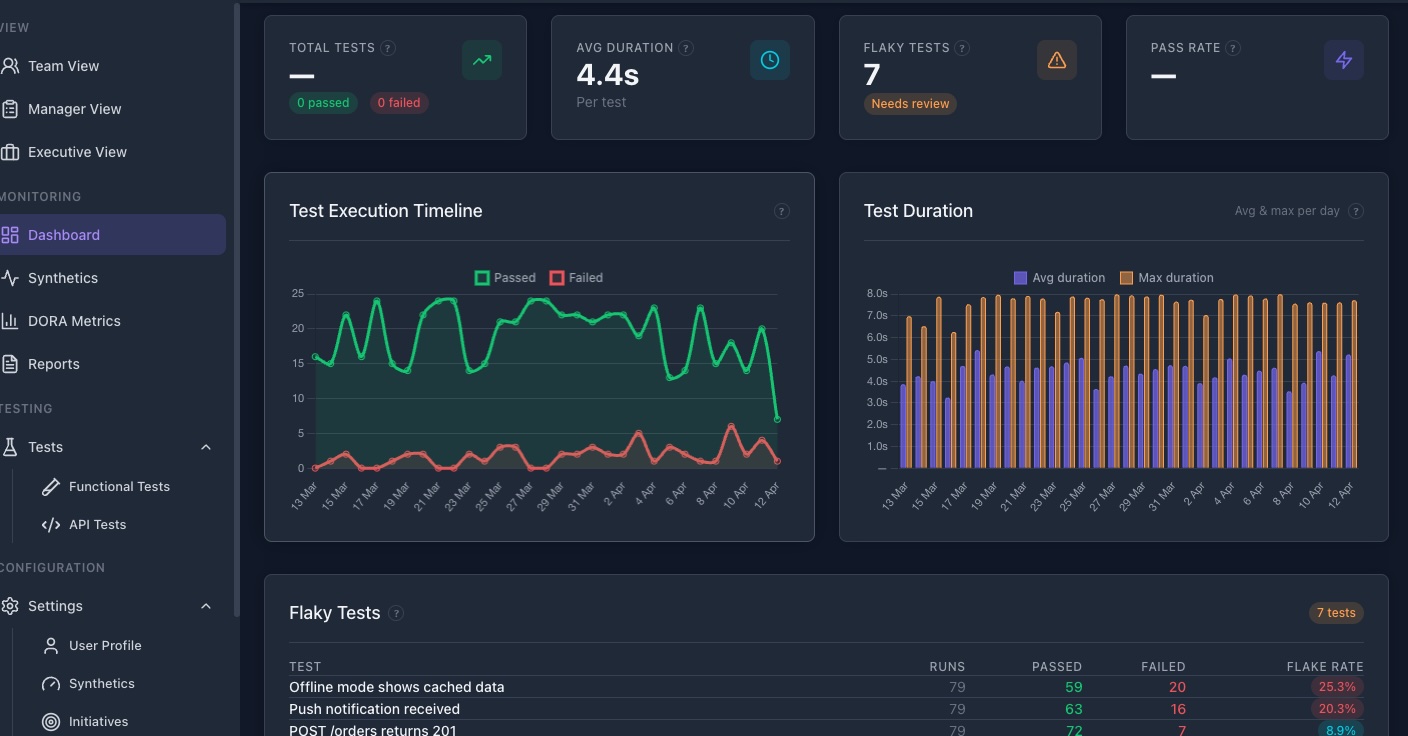
Test Status Dashboard
Test Status & Flaky Detection
Synthetic Monitoring
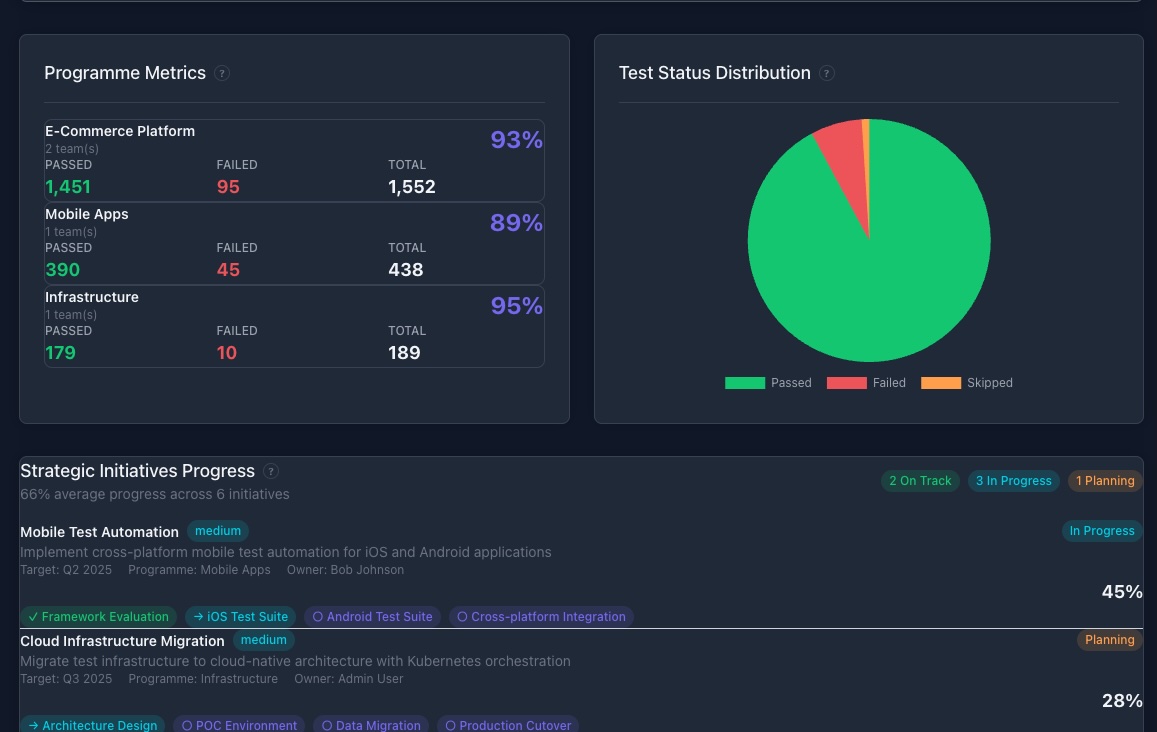
Programme Metrics and Strategic Initiatives
Executive — Programme Metrics

Plans for every team size

No per-test fees. No seat limits. Pricing is tailored to your organisation — request a quote to get started.

Starter

For QA teams who need multi-project visibility and deeper history.


  • 5 projects
  • 90-day result history
  • Team & Manager dashboards
  • All framework imports
  • REST API access
  • DORA metrics
  • Synthetic monitoring
Enterprise
Custom

For large organisations needing SLAs, air-gapped deployment, and dedicated support.


  • Everything in Pro
  • Air-gapped deployment
  • Dedicated onboarding
  • SLA & priority support

Need Aurora too? See the Suite bundle →


How we compare

Built for teams who can't afford to send test data to a third-party cloud — or pay per execution.

Feature Aurora Continuum Allure TestOps Datadog CI Visibility BrowserStack DIY (Grafana)
Self-hosted ✓ Always Cloud or self-hosted ✗ Cloud only ✗ Cloud only
Data stays in your infrastructure Self-hosted option
Multi-framework support ✓ All major frameworks Limited Browser tests only Build it yourself
DORA metrics ✓ Built in Manual setup
Synthetic monitoring ✓ Built in Separate product Separate product Manual setup
Executive dashboards ✓ Team / Manager / Executive Limited Custom only Build it yourself
Flaky test detection
Compliance / audit reports ✓ PDF with sign-off Basic
Pricing model Flat fee per instance Per user / per test Per host + per event Per parallel / per minute Infrastructure cost only
Self-hosted deployment ✓ Helm charts Complex self-host Multi-service setup

Competitor information based on publicly available pricing and documentation. Last reviewed April 2026.


Common questions

Everything you need to know about Aurora Continuum.

Deploy to your Kubernetes cluster using our Helm charts. Follow the Deployment Guide for configuration and secrets setup.
A license is required to run Continuum. Starter and Pro unlock progressively higher limits on teams, projects, result history, and features such as DORA metrics, synthetic monitoring, and executive dashboards.
Update the Helm chart version and run `helm upgrade`. Configuration and run history are preserved in persistent volumes.
Yes — Continuum accepts results from GitHub Actions, Azure DevOps, AWS CodeBuild, GitLab CI, and any system that can make an HTTP request. See the CI/CD Integration guide.
Playwright, Cypress, Selenium (Java, Python, JS), JUnit, TestNG, pytest, NUnit, RSpec, Go test, and any framework that outputs JUnit-compatible XML.
Never. Continuum runs entirely inside your own infrastructure. No telemetry, no cloud sync, no third-party data processors.

Get help

Reach out via email and we'll get back to you.

Email Support

Deployment, configuration, and licensing questions.

support@selectred.com

Guides & Docs